Statistics about Graduate Students
Content Limitation
This page is incomplete and only reflects English, US-based resources at the moment. Please contribute!
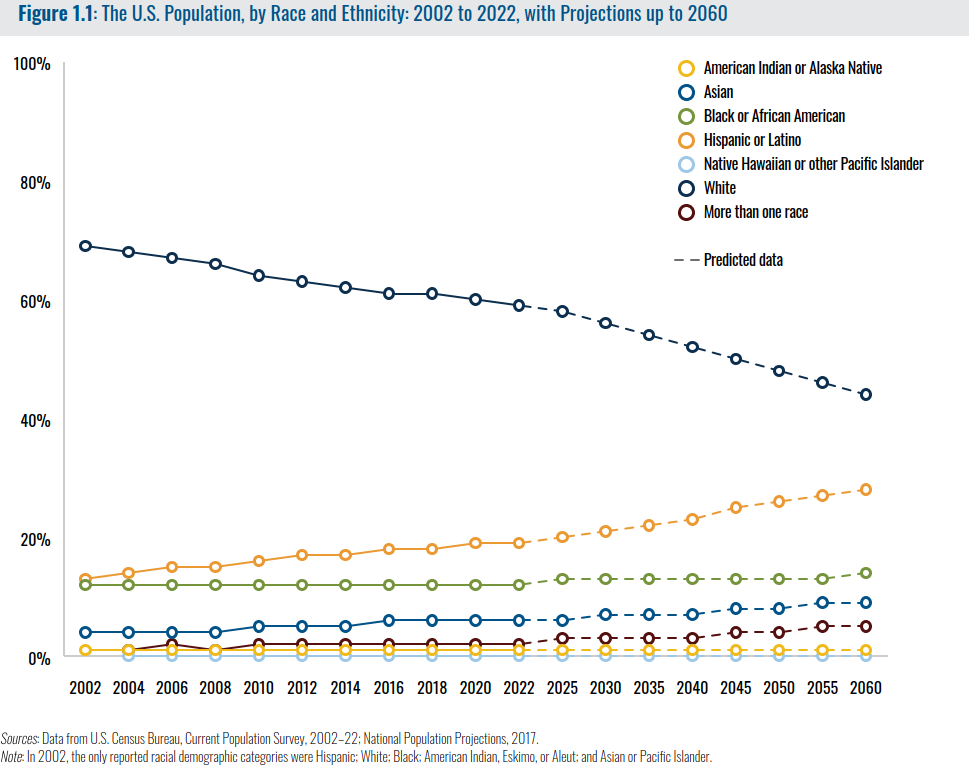
The U.S. Population (x Race/Ethnicity) 2002-2022, w/Projections to 2060
| US Source: American Council on Education (ACE). Race and Ethnicity in Higher Education: 2024 Status Report. Chapter One. |
|---|
 |
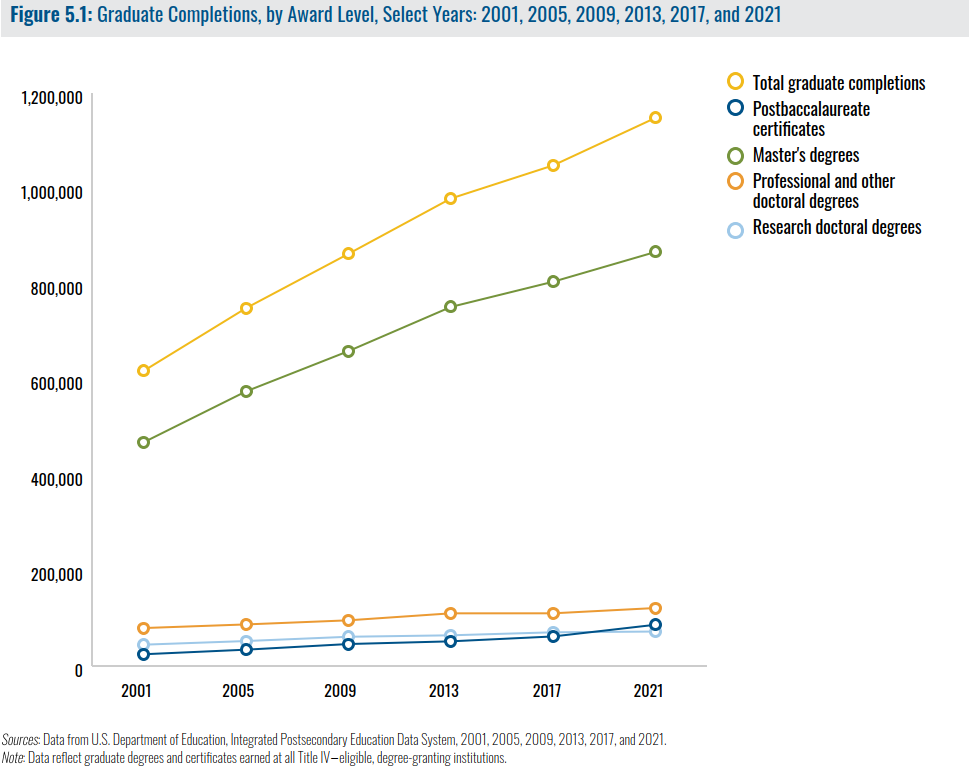
Graduate Completions (x Award Level) Select Years
| US Source: American Council on Education (ACE). Race and Ethnicity in Higher Education: 2024 Status Report. Chapter five. |
|---|
 |
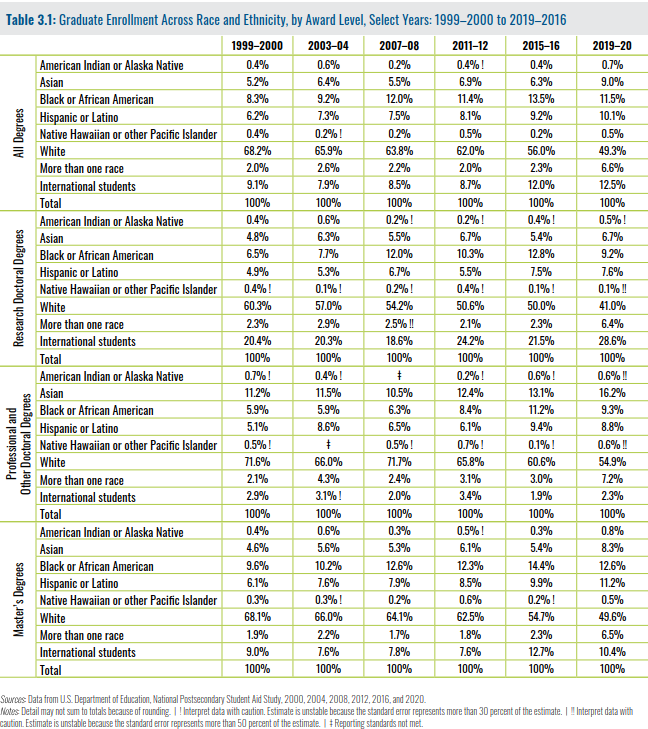
Graduate Enrollment (Race/Ethnicity x Award Level) Select Years 1999–2000 to 2019–2016
|  |
|
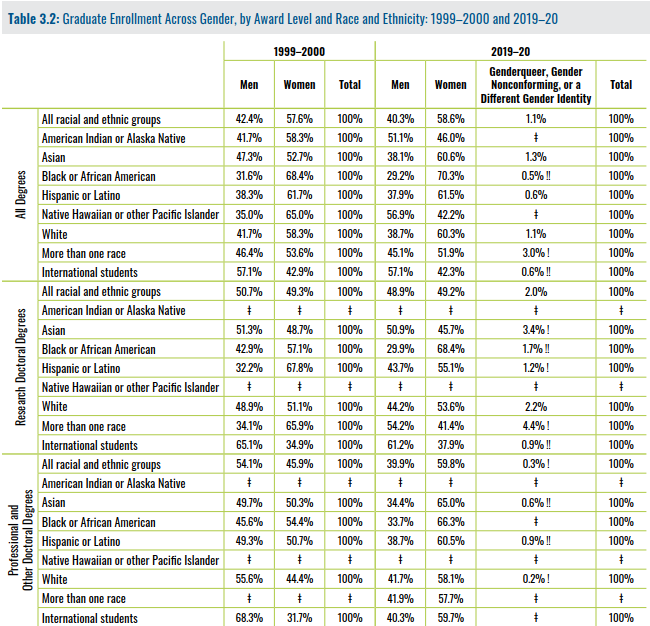
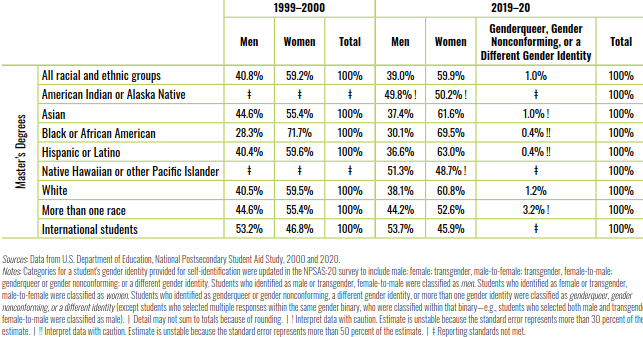
Graduate Enrollment (Gender x Award Level x Race/Ethnicity) 1999–2000 and 2019–20
| US Source: American Council on Education (ACE). Race and Ethnicity in Higher Education: 2024 Status Report. Chapter Three. |
|---|
 |
 |
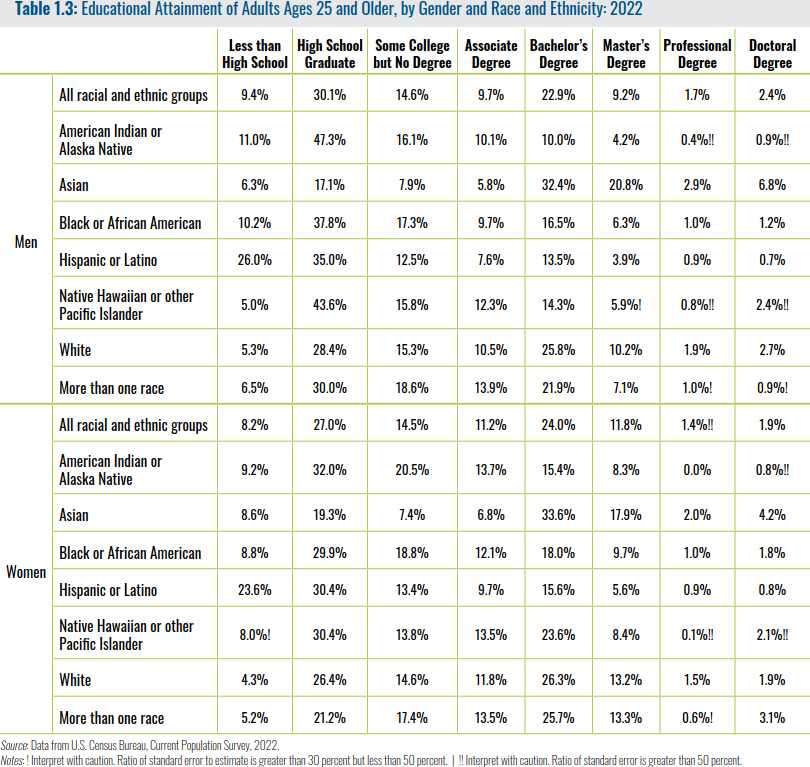
Educational Attainment of Adults Ages 25 and Older (Gender x Race/Ethnicity)
| US Source: American Council on Education (ACE). Race and Ethnicity in Higher Education: 2024 Status Report. Chapter One. |
|---|
 |
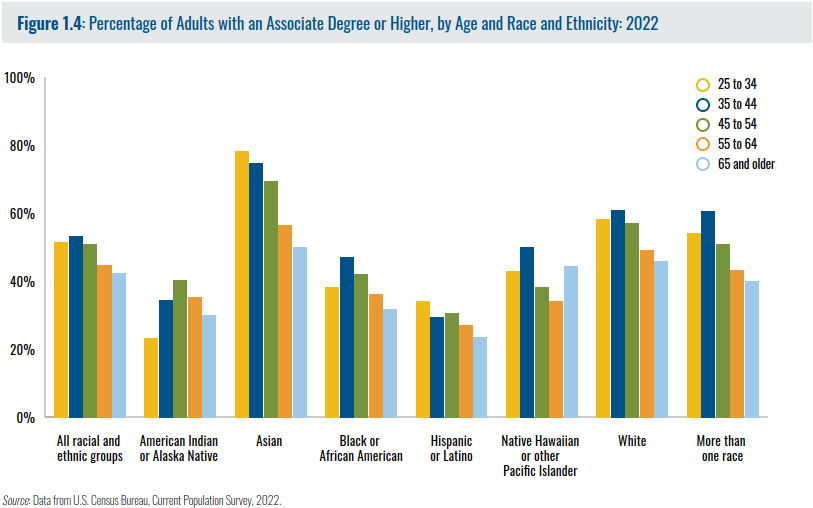
Percentage of Adults with an Associate Degree or Higher (Age x Race/Ethnicity)
| US Source: American Council on Education (ACE). Race and Ethnicity in Higher Education: 2024 Status Report. Chapter One. |
|---|
 |
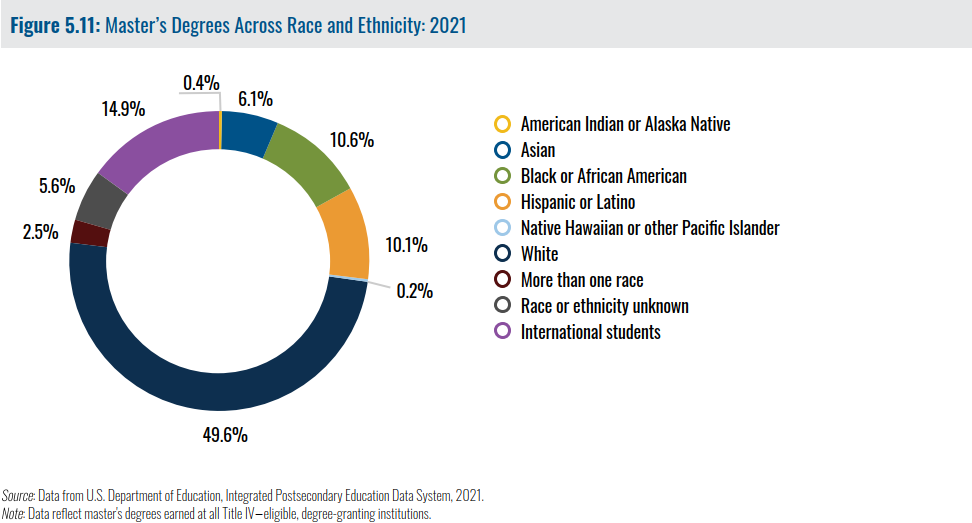
Master’s Degrees Across Race and Ethnicity 2021
| US Source: American Council on Education (ACE). Race and Ethnicity in Higher Education: 2024 Status Report. Chapter Five. |
|---|
 |
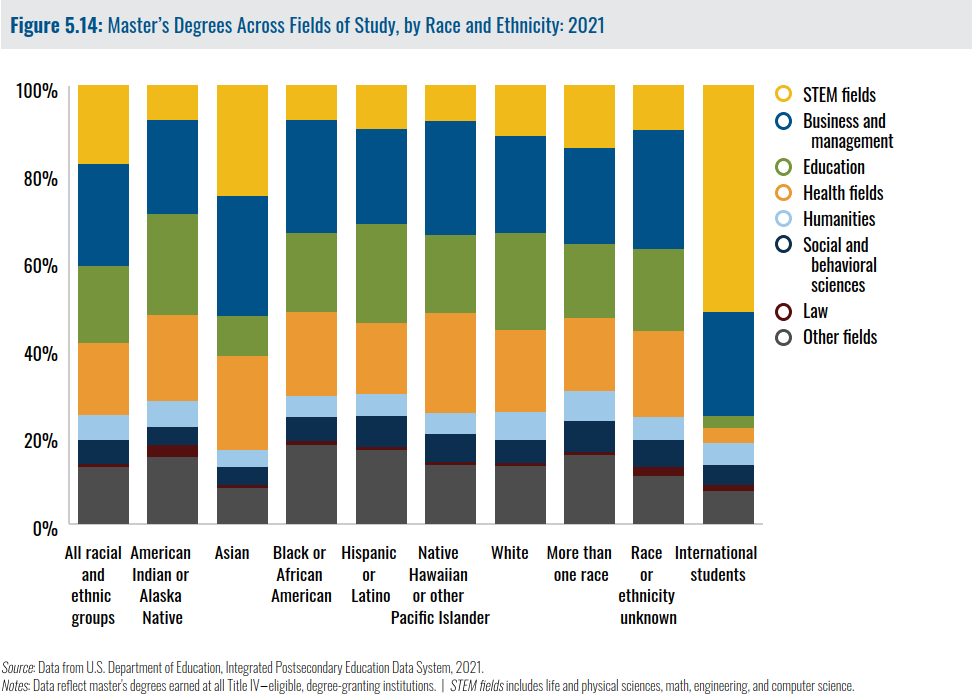
Master’s Degrees Across Fields of Study, by Race and Ethnicity 2021
| US Source: American Council on Education (ACE). Race and Ethnicity in Higher Education: 2024 Status Report. Chapter Five. |
|---|
 |
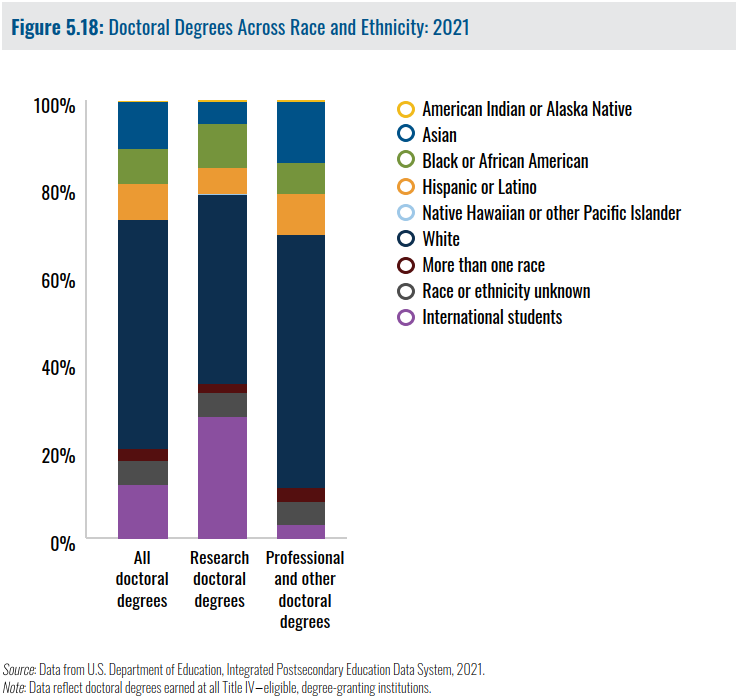
Doctoral Degrees Across Race and Ethnicity 2021
| US Source: American Council on Education (ACE). Race and Ethnicity in Higher Education: 2024 Status Report. Chapter Five. |
|---|
 |
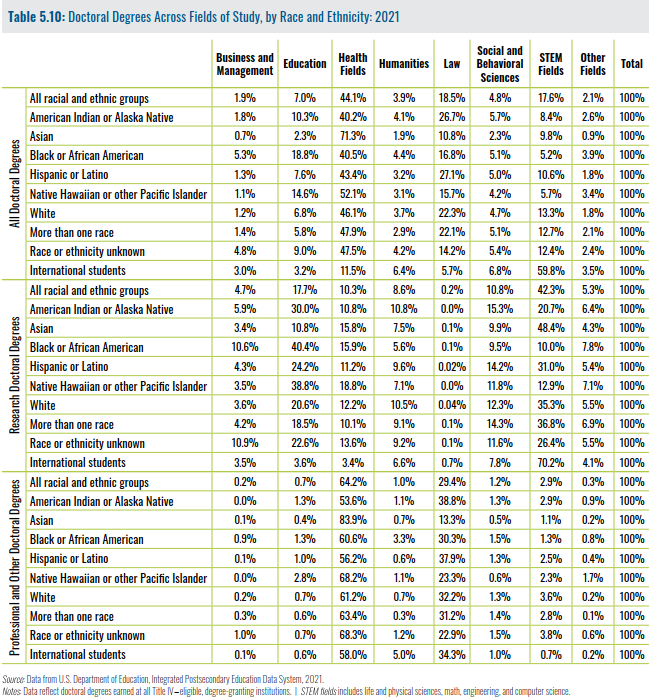
Doctoral Degrees Across Fields of Study, by Race and Ethnicity 2021
| US Source: American Council on Education (ACE). Race and Ethnicity in Higher Education: 2024 Status Report. Chapter Five. |
|---|
 |
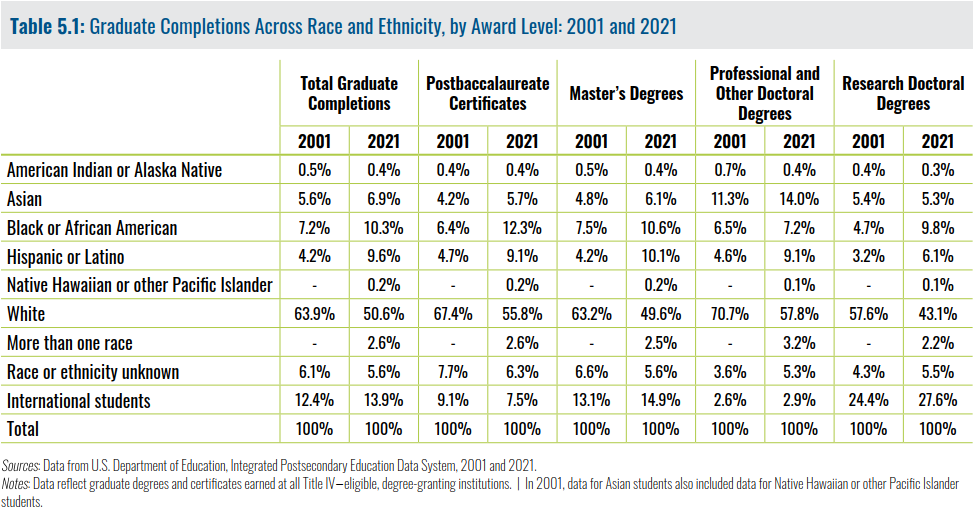
Graduate Completions Across Race and Ethnicity, by Award Level 2001 and 2021
| US Source: American Council on Education (ACE). Race and Ethnicity in Higher Education: 2024 Status Report. Chapter Five. |
|---|
 |
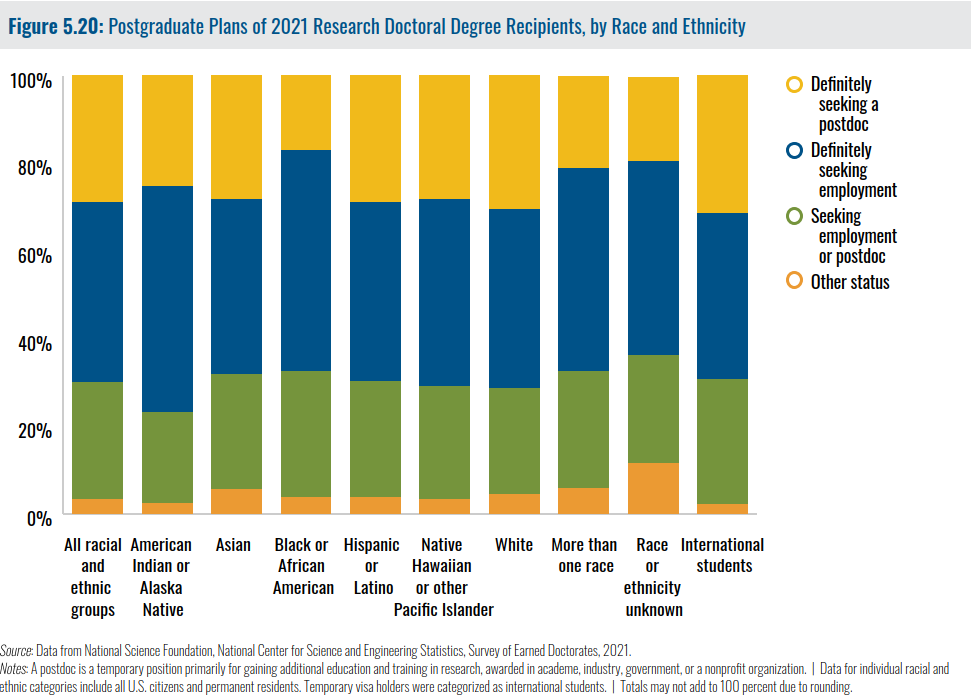
Postgraduate Plans of 2021 Research Doctoral Degree Recipients, by Race and Ethnicity
| US Source: American Council on Education (ACE). Race and Ethnicity in Higher Education: 2024 Status Report. Chapter Five. |
|---|
 |